


Trade balance
The UK trade surplus with non-EU countries has grown unevenly relative to UK GDP since 2000 to reach 1.4% of GDP in 2025 (see Figure 5.11). By contrast, the trade deficit with the EU has also expanded, mainly since 2011, to -3.3% of GDP in 2025. The temporary recovery during 2020 and 2021 was due to the effects of Covid.
Note that the non-EU trade surplus grew from less than 1% of GDP before 2007 up to 2.5% in 2018, which shows that EU membership enabled the UK to grow trade with non-EU countries.
The majority of UK trade prior to Brexit was through trade deals with the EU (see the section UK-EU trade for more details). Unsurprisingly, after the post-Brexit Trade and Cooperation Agreement began in early 2021, the UK’s total trade deficit accelerated as a percentage of GDP. The ratio of the UK’s non-EU trade surplus to GDP also dipped, but not as steeply as the EU trade deficit did, and remains below its 2018 level.
Figure 5.11: UK balance of trade (goods and services) with EU and non-EU countries

Sources:
ONS, Gross Domestic Product: chained volume measures: Seasonally adjusted, 14 May 2026
ONS, Breakdown of trade data, 31 March 2026
Current or real prices?
Always check the basis behind any trade statistics!
When looking at trends in trade figures, economists often use statistics in constant (or ‘real’) prices: they remove inflation. This is because the inflation included in Current Prices (‘CP’) does not create any value and distorts comparisons between different periods. ONS refers to real prices as Chained Volume Measures (‘CVM’):
- Chained Volume Measures are a “real” measure in that they have had the effect of inflation removed by fixing the prices of goods and services to a base year. The resultant figures measure the ‘change in volume’ between periods, not the change in prices.
- Current Prices measure the actual price paid for goods or services and are not adjusted for inflation but are usually seasonally adjusted.
Current prices are best used for analysing trade for a single period rather than multi-year trends. However, be warned that politicians often prefer to use current prices for trends because they show growth due to inflation.
Another distortion in UK goods trade figures relates to precious metals. Precious-metal transactions (non-monetary gold and silver, platinum etc.) can involve £ billions and their prices are volatile. However, these imports and exports do not impact UK GDP because they reflect change of ownership rather than physical movement of goods. As a result, it’s usually better to exclude precious metals from goods trade statistics.
Please also note that ONS changed its methodology for collecting statistics on goods trade with the EU in 2021. The ONS estimates that this change increased reported exports to the EU by around 5% from 2021 onwards, and reported imports by around 6% from 2022 onwards. These material changes should be taken into account when comparing post-2021 UK-EU goods trade with pre-Brexit and pre-TCA figures.
How big is the effect of inflation?
Figure 5.12 shows how inflation and precious metals have affected recent export figures.
- In 2025, current price exports of goods and services were £930 billion, including precious metals, but, in constant prices, exports were only £906 billion. Inflation added £22 billion and precious metals £3 billion.
- This is a relatively small inflation difference because the current base year is 2023. The inflation gap will widen over time.
The ONS updates and refines its estimates for trade flows, so the latest ONS figures for may differ from earlier published figures.
Alternative estimates for trade are available from other sources, such as Comtrade at the UN.
Figure 5.12: Current prices, chained volume measures and precious metals

Sources:
ONS, Breakdown of trade, 31 March 2026
ONS, UK trade in goods, year in review: 2023, 1 March 2024
ONS, Impact of trade in goods data collection changes on UK trade statistics: summary of adjustments and the structural break from 2021, 22 January 2024
Goods and services balances
In 2025, the UK’s overall trade was £1,863 billion (CVM, excluding precious metals), split 54.3% Non-EU and 45.7% EU (see Table 5.4 and Figure 5.13). The EU was, by far, the UK’s biggest single trading partner.
The UK had a total trade deficit of £52 billion in 2025 reflecting:
- a deficit in goods trade of £242 billion offset by a surplus of £190 billion in services;
- a deficit of £93 billion with the EU and a non-EU surplus of £41 billion:
- with the EU, services produced a £46 billion surplus and goods a £139 billion deficit;
- with the non-EU, services produced an £144 billion surplus and goods a £103 billion deficit.
- manufacturing plays a critical role in exports to the EU (£184 billion in goods almost matches £195 billion in services) and a major role in non-EU exports (£202 billion vs £324 billion);
- manufacturing is much more important to UK trade than its small, 9%, share of overall economic output implies (see section on economic context).
Table 5.4: UK trade balance in 2025
2025 EU/non-EU trade (£m - CVM)
EU Non-EU Total EU as % of total
Total trade (exports+imports) 851 1,012 1,863 45.7%
Goods
Exports 184 202 387 47.7%
Imports -323 -306 -629 51.4%
Balance -139 -103 -242
Services
Exports 195 324 519 37.5%
Imports -149 -180 -328 45.3%
Balance 46 144 190
Total
Exports 379 526 906 41.9%
Imports -472 -486 -958 49.3%
Balance -93 41 -52
Source: ONS
Figure 5.13 (a Marimekko or Mekko chart) shows the EU and non-EU trade profiles for 2025 by goods, services, imports and exports:
- EU trade (total of imports and exports) was 45.7% of total trade and 54.3% was non-EU
- EU trade was made up of:
- goods imports (38.0%) and exports (21.7%)
- services imports (22.9%) and exports (17.5%)
- non-EU trade was made up of:
- services exports (32.0%) and imports (17.7%)
- goods imports (30.2%) and exports (20.0%)
In simple terms, the UK trades services mainly to non-EU markets for goods imports mainly from the EU.
Figure 5.13 Breakdown of 2025 trade

UK trade trends – EU/non-EU
Points to note on the trend in EU/non-EU share include (see Figure 5.14):
- Recent movement in EU/non-EU shares is mainly due to Brexit making trade with the EU more difficult. In addition, the German and French economies have been underperforming their G7 counterparts.
- Non-EU share of UK trade has been growing since 2006 and has been over 50% since 2008:
- its previous lows were in 2002 (45.0%) and 2006 (45.9%);
- before Brexit, in 2015, the non-EU share stood at 51.6%;
- in 2018, it was 51.0% – the last stable year of trade before Brexit negotiations and then Covid disrupted trade patterns;
- by 2025, the non-EU share was 54.3%.
- EU share of UK trade dropped from 49.0% in 2018 to 45.7% in 2025.
Figure 5.14: EU and non-EU shares of trade

UK trade trends – goods and services
Some key observations on the trends in exports and imports of goods and services are (see Table 5.4 and Figure 5.15):
- Goods
- Exports grew progressively from 2010 to hit a high in 2018 of £438 billion but have declined since then to £387 billion in 2025.
- Imports have grown each year since 2010 (apart from 2020 and 2021) to £629 billion in 2025.
- Goods trade deficit reached a new peak in 2025 of £242 billion.
- Services
- Exports grew progressively since 2010 (apart from 2020 and 2021) to reach a high point of £519 billion in 2025.
- Imports followed a similar pattern rising to £328 billion in 2025, causing the services trade surplus to reach a new high of £190 billion.
- Trade balance
- Net trade balance has been in deficit since 2014, growing gradually to £52 billion in 2025 as the goods deficit has grown faster than the services surplus.
Figure 5.15: Trend in exports and imports of goods and services
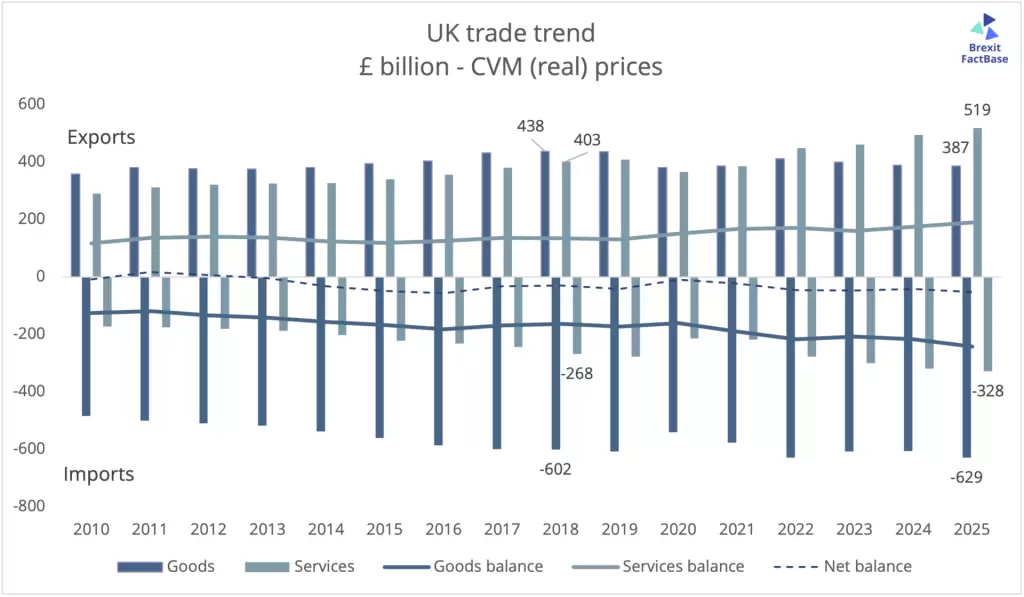
Source: ONS, Breakdown of trade, 30 September 2025
Importance of gravity
Countries trade the most with their nearest neighbours. As a rule of thumb, the data shows that trade between economies of equal size halves with a doubling of distance.
Trade economists have developed ‘gravity models’ based on the relationship between trade, size of economy and distance to model likely volumes of trade between countries.
There are trading opportunities for smaller economies with distant, larger economies that can mitigate the effect of distance (like the US and China). History, culture, legal systems and language can also facilitate trade with distant countries (such as between the UK and Australia or Canada).
Hover over the bubbles on the interactive chart at Figure 5.16, which maps UK exports and distance. You will find the UK’s exports are concentrated on nearest neighbours, with the notable exception of the US, because its economy is so much bigger than the UK’s. The ONS chart uses exports of goods and services for 2016.
Some Brexiters criticise gravity models, but trade specialists and academics assert that the predictive powers of gravity models show that they are robust. See, for example, this report from PwC in 2017:
Figure 5.16: UK exports by distance
Top UK trading partners
The UK’s top 10 trading partners accounted for about 60% of total trade in 2025.
At the level of individual countries, partners that receive high exports tend to provide high imports, indicating the benefits of reciprocal trading relationships (see Figures 5.17 and 5.18). Similar patterns apply to goods and services trade as well as the rank ordering of partners. Not also that the UK’s main trading partners are also its main sources of inward-bound foreign direct investment (see separate section on investment).
On the UK’s top trading partners for exports in 2025:
- the top ten were all neighbours in Europe except for the US (21.8%) and China (3.4%);
- the EU accounted for 41.4%;
- the US was the top UK individual export destination, accounting for 21.8% of goods and services exports;
- Germany was the second most important individual export market with 6.7% of exports and Ireland was the third (6.1%).
Figure 5.17: Top trading partners – 2025 exports (current prices)

On imports (see Figure 5.18), the pattern was similar:
- the EU accounted for 49.0% of imports;
- the US was the top UK individual source of imports, accounting for 13.3% of goods and services exports;
- Germany was the second most important export market with 9.3% of imports;
- China was the third individual source at 7.6%
Figure 5.18: Top trading partners – 2025 imports (current prices)

Source: HMG, UK Trade in Numbers 19 June 2026
Top ten UK goods categories
The UK’s top 10 goods categories for imports and exports are shown in Figures 5.19 and 5.20.
As the overlapping categories in Figures 5.20 and 5.21 imply, imports and exports are often interlinked. The interconnected nature of global trade means that a country’s imports and exports cannot be treated as independent quantities, as the Institute for Fiscal Studies observed.
Over two-thirds of UK goods and services exports are of intermediate components for overseas producers. The IFS estimated that over half of UK goods and services imports from the EU were inputs to UK production of goods and services.
If you would like to dig deeper, go to ‘Interactive tools’ to interrogate the ONS trade data by trade partner and by commodity.
Figure 5.19: Top ten UK goods import categories (year to March 2026 – current prices)

Figure 5.20: Top ten UK goods export categories (year to March 2026 – current prices)

Sources:
Institute of Fiscal Studies, Firms’ supply chains form an important part of UK-EU trade: what does this mean for future trade policy? 8 January 2018
HMG, UK Trade in Numbers 19 June 2026
Top UK services categories
In 2025, the UK had a trade surplus in services of £204.6 billion from exports of £545.7 billion and imports of £341.1 billion (in current prices). The top 5 services categories accounted for £463.6 billion or 85% of services exports and £291.0 billion or 85% of imports (based on the year to March 2026 so not quite comparing apples with apples). See Figures 5.21 and 5.22.
Three categories stood out as the most important contributors to the UK’s services trade surplus in services:
- financial services generated a surplus of £85 billion, with exports of £106.6 billion and imports of £21.1 billion;
- other business services (for which the ONS should really show its components rather than lumping them together as ‘other’) contributed a surplus of £66.5 billion from exports of £194.0 billion and imports of £127.5 billion). Other business services comprise:
- professional and management consulting services including legal, accounting, management consulting, public relations, advertising, and market research
- technical and trade-related business services including architectural, engineering, and scientific services
- research and development services
- telecoms, computer and information services contributed exports of £51.3 billion and a trade surplus.
For transportation services and services through affiliates, exports and imports were roughly equal.
Travel was the only category with a trade deficit, of £15.6 billion, which was due to more UK travel abroad than inbound travellers.
The section on UK-EU trade provides details on the make up of ‘other business services’ for 2025.
Figure 5.21: Top five UK service export categories (year to March 2026 – current prices)

Figure 5.22: Top five UK service import categories (year to March 2026 – current prices)

Sources:
Source: HMG, UK Trade in Numbers 19 June 2026
ONS, UK trade in services: service type by partner country, non-seasonally adjusted, 24 April 2026