


Trend in GDP growth
The trend in GDP growth after the Brexit vote in 2016 to early 2018 showed the UK economy growing faster than most G7 economies (see Figure 4.15).
The UK’s annual GDP growth rate then dropped to the middle of the G7 in 2018 and 2019. With the arrival of Covid in 2020, the UK plunged to the lowest of the G7. In 2022, initially, the UK responded by growing the most strongly.
However, by 2024, the UK had slipped close to the bottom of the G7, before moving to mid-table by mid-2025 where it has stayed until Q1 2026. The UK’s improved position has benefited from low economic growth in Germany and Japan since 2019.
Figure 4.15: UK GDP growth vs G7 (2015-2026)
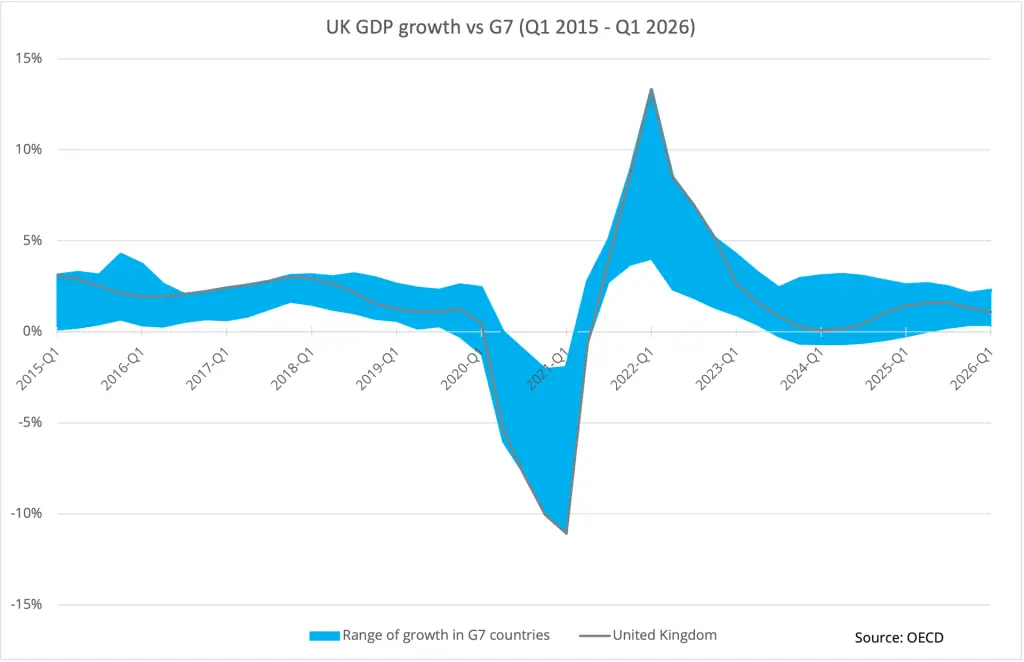
Source: OECD Data Explorer
Between Q4 2019 (pre-pandemic) and Q1 2026, the UK economy had grown by 6.0% in real terms (see Figure 4.16 from the regular House of Commons Briefing). This put the UK fifth of the G7, above Japan and Germany but just behind France and the Eurozone. Canada and the US have performed much more strongly.
Figure 4.16: G7 real GDP % change compared to pre-pandemic level
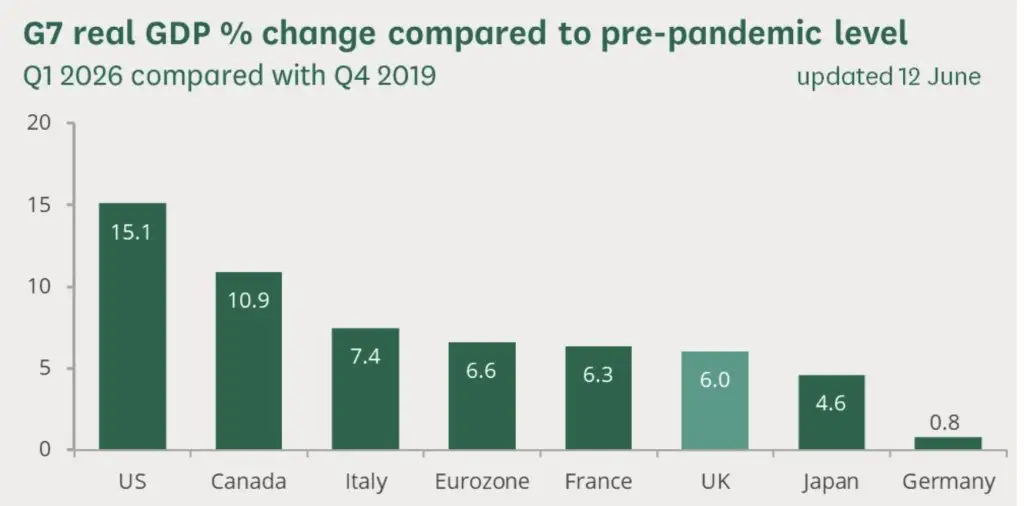
Source: House of Commons Library, GDP international comparisons, June 2026
Economic impact of Brexit
Economists face two challenges: estimating the long-term Brexit impact and deciding how much has already happened.
The consensus view is that Brexit has caused major harm to the economy, but estimates vary. These impacts are:
- uncertainty;
- reduced productivity;
- reduced trade:
- non-tariff barriers on UK-EU trade which disadvantage the UK;
- lower trade openness and volumes;
- immaterial benefits from new UK trade deals.
- weaker business investment;
- reduced EU immigration leading to labour shortages offset by increased non-EU immigration. However, since Brexit this has been mitigated by increased non-EU immigration. See immigration section for details.
The Office of Budget Responsibility (OBR) puts the Brexit impact at a long-run loss of 4% of GDP. The OBR figure is the average of thirteen studies from reputable organisations between 2016 and 2019 that assessed the impact of replacing EU membership with a Free Trade Agreement.
However, other reputable studies assess the impact as much higher: 5-6% (National Institute for Economic and Social Research, 2023), 8% (Goldman Sachs, 2024) and 6-8% (National Bureau of Economic Research, 2025).
In June 2025, the Constitution Society published a report by John Springford, which assessed the Brexit impact nine years on. The report concluded the impact was around 5%. (He developed the well-regarded doppelgänger approach to assess how the UK would have performed against similar economies, if it had remained an EU member.)
Estimates of the economic impact of Brexit that has already happened range from 2% to 8% of GDP:
- NBER estimated the cumulative economic impact by 2025 was 6-8%;
- Professor Jonathan Portes of Kings College London argued for 2-3% by 2023;
- NIESR put the impact to the end of 2023 at 2.5%;
- Goldman Sachs put it at 5%.
If we ignore the higher estimates and assume the OBR figure of 4% has already happened, Brexit would have reduced current annual GDP (of just under £3 trillion in nominal terms) by about £120 billion, and shrunk the tax revenues flowing into the public finances by £46 billion (overall UK tax revenues are roughly 38% of GDP).
Sources:
National Bureau of Economic Research, The Economic Impact of Brexit, November 2025
House of Commons Library, GDP – International Comparisons: Key Economic Indicators, November 2025
OBR, Brexit analysis, July 2025
The Consitution Society (in association with the Federal Trust), The economic impact of Brexit, nine years on: was the consensus right?, June 2025
Goldman Sachs, The Structural and Cyclical Costs of Brexit, February 2024
NIESR, Revisiting the impact of Brexit, Autumn 2023
Professor Jonathan Portes, CEPR, The impact of Brexit on the UK economy: Reviewing the evidence, July 2023
Jonathan Springford, Centre for European Reform, Are the costs of Brexit big or small?, May 2023
Trade openness trend vs G7
Trade openness is the ratio of goods and services trade to GDP and indicates how much an economy benefits from trade, the sum of imports and exports. The trade openness ratio depends on structural, historic and cultural factors. This means that the position of one country relative to another should not change rapidly. (For global trends, please see Global trade.)
The G7 had an average trade openness of 41.9% in the year to Q1 2026 (see Table 4.5). It also has a wide range bounded by the US with 25.4% and Germany with 80%. See Figure 4.17 for the indexed G7 trend, its widening range and the UK’s position within it.
As expected, the UK experienced a very large fall trade openness after 2018, consistent with reduced trade growth from Brexit uncertainty and trade barriers with the single market. The UK is now middle of the pack.
Table 4.5 shows the changes for each G7 member for the year ending in Q1 2026 since Q4 2018. Points to note include:
- G7 trade openness has fallen by 0.3%, driven by falls in the US of 0.4% and Canada of 2.5%
- UK trade openness has grown by 0.9%, above France on 0.3%
- Germany (4.0%), Japan (2.8%) and Italy (2.8%) have grown the most
The small increase in UK trade openness of 0.9% is caused by services trade growth outpacing the rate of growth in GDP since Brexit (see Figure 4.18). This cancels out the effect of UK goods trade growing more slowly than GDP since Brexit. (Note that these are quarterly data points rather than annual data points.)
Figure 4.17: G7 trade openness trend
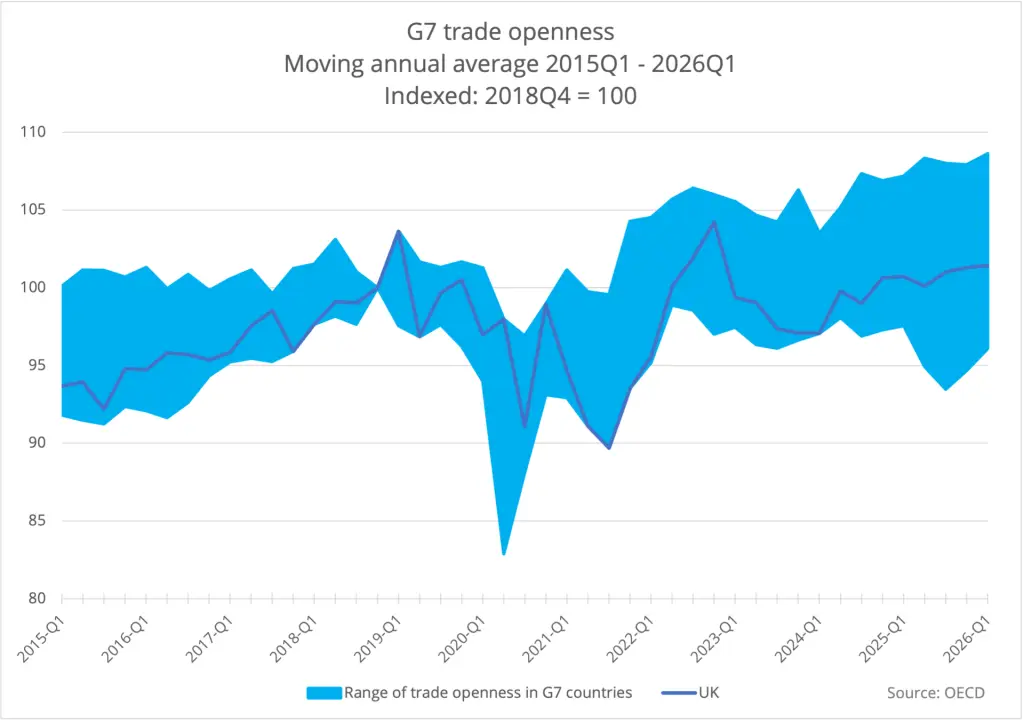
Table 4.5: G7 trade openness
| Year to 2015 Q1 | Year to 2018 Q4 | Year to 2026 Q1 | Difference 2026Q1 - 2018Q4 | |
|---|---|---|---|---|
| Canada | 63.7% | 63.6% | 61.1% | -2.5% |
| France | 59.0% | 63.6% | 63.8% | 0.3% |
| Germany | 72.1% | 75.9% | 80.0% | 4.1% |
| Italy | 52.6% | 57.3% | 60.1% | 2.8% |
| Japan | 30.7% | 32.6% | 35.5% | 2.8% |
| United Kingdom | 57.6% | 61.5% | 62.4% | 0.9% |
| United States | 25.4% | 25.8% | 25.4% | -0.4% |
| G7 weighted average | 40.5% | 42.3% | 41.9% | -0.3% |
Source: OECD Data Explorer
Figure 4.18: UK trade openness for goods and services
